DNA Centimorgan Chart for Understanding DNA Relationships
A DNA centimorgan chart is a chart that shows the relationship between two DNA strands and it can be very useful when it is applied to understanding your family history. In this article, we will explain centimorgans and how a DNA centimorgan chart can be used in genealogy.
Once you have had your DNA taken for an ethnicity estimate and enjoyed finding out what regions of the world your ancestors may have come from, what else is there? Well, if you tested with AncestryDNA or 23andMe you likely have an extensive list that features a few close relatives and potentially hundreds if not thousands of distant cousins.
AncestryDNA is Our Top Recommendation
After reviewing all of the top DNA products on the market, nothing comes close to AncestryDNA to help you discover your whole family story!
They give you so much more than any other family tree DNA kit, and let you connect to the places you're from in the world where your family story started, and even help you to discover living relatives you never knew you had!
For the most accurate family history research based on your DNA, sign up for AncestryDNA now!
Get AncestryDNA →When we go back in our family tree four or five generations we start to realize how many people alive today could be descended from our great-great-great grandparents and beyond. These are people with whom we may share portions of DNA. The closeness of our DNA match is measured in a unit known as centimorgans but what are they and how can they be used?
Centimorgans Explained
It is important that before we explore how to use centimorgans in our family tree research we must first learn what they are. Centimorgans (cM) are a unit of measurement that allows us to track the sizes of shared DNA that we share with other individuals.
This should not be confused with centimeters (cm) because it is not a distance measurement in the same regard. Rather than being a physical distance centimorgans (cM) are a genetic distance measurement.
Each person has roughly 6800 centimorgans of DNA. So essentially the number of the cM match we have with an individual indicates how much of that 6800 we share in common with someone. The more we share the closer the potential relationship.
What Is a Centimorgan Chart?
Knowing the number of centimorgans we share with someone else is of little use unless we have a way to understand that information. There are numerous centimorgan charts online which can give us a decent idea of what we are looking at but one stands out above all others.
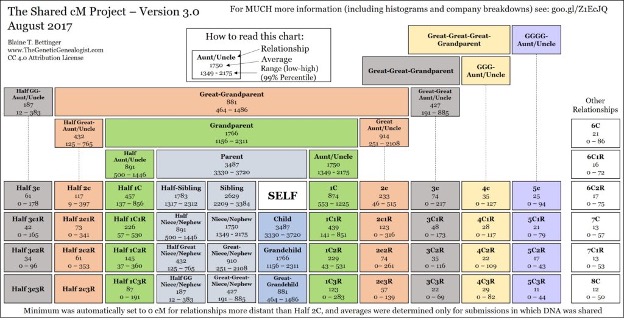
The DNA cM chart is the brainchild of genetic genealogy expert Blaine Bettinger. In June of 2016, Bettinger released the first version of his Shared cM Project which was the result of years of study. This study helped to determine reasonable familial relationship estimates between individuals with matching DNA.
This project of Bettinger’s is an ongoing study and he accepts new submissions constantly. As a result, the chart has been often updated and is likely the most accurate DNA relationship estimator there is.
Bettinger’s chart is laid out to show family matches with the corresponding average cM number that you should expect for that match. The nature of DNA being somewhat variable, Bettinger has also included acceptable ranges into which a particular relationship might fall.
How to Use a Centimorgan Chart
The obvious important first step to using a centimorgan chart is to know how much DNA you share with the match you are trying to research. AncestryDNA or 23andMe will likely have already made a suggestion as to the connection but this is not always the most accurate.
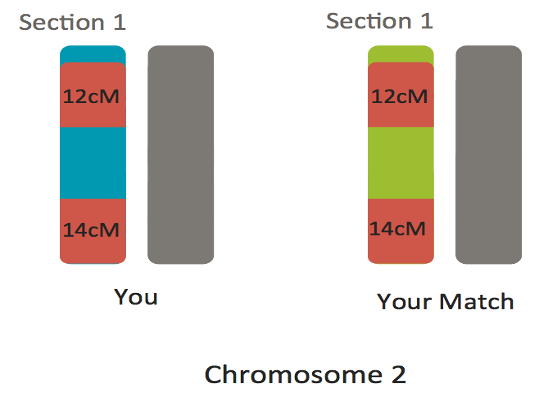
It is important to note that the cM amount we share with a match may just be on one segment of DNA but it can also be multiple. If it is multiple segments then the cM amount will be a total of all of them.
Once you have the cM match amount look at the Bettinger DNA cM chart. It is likely that the amount you share with a person may fall into several categories. Make note of all the possible relationships you may have to this person.
As an example, let's assume you share 433 cM with your proposed match, what are the possible relationships?
| 433 Centimorgan Match Possibilities | |
|---|---|
| Relationship | cM Range |
| Great-Great Uncle/Aunt | 191 – 885 cM |
| Great Uncle/Aunt | 251 – 2108 cM |
| Half Great Uncle/Aunt | 125 – 765 cM |
| Half First Cousin | 137 – 856 cM |
| Second Cousin | 46 -515 cM |
| Half First Cousin Once Removed | 57 – 530 cM |
| First Cousin Once Removed | 141 – 851 cM |
| Half Great Niece/Nephew | 125 – 765 cM |
| Great Niece/Nephew | 251 – 2108 cM |
| First Cousin Twice Removed | 43 -531 cM |
| Great-Great Niece/Nephew | 191 – 885 cM |
According to Blaine Bettinger’s DNA Centimorgan relationship charts there are 11 different potential relationship matches into which a 433 cM match might fall into.
Apply Logic
Once you consult the chart and discover that there are 11 possible ways you are related to this person it is time for some logical thinking. You can easily eliminate several of these options based solely on likely age. If you and your match are close in age then it is unlikely they are:
- Great uncle or aunt
- Half great uncle or aunt
- Half great nephew or niece
- Great nephew or niece
- Great-great nephew or niece
This brings the potential familial matches down to just 5 possibilities. It is most likely, given the low 433 cM match you share, that this relationship is a cousin-based connection. So it is time to start looking at the family trees, yours and if possible theirs.
Follow the Branches
Delving into your genealogical research may help you determine the most likely relationship possibilities. It is important to remember to keep an open mind as well because sometimes these matches can bring up surprises.
You may be of the understanding that neither of your parents has any known siblings. If this is the case you would have no first cousins and therefore no half first cousins. Understand though we can never be 100% sure that there are no secret half-siblings that even our parents do not know. The child of your parents' half-sibling would be your half first cousin.
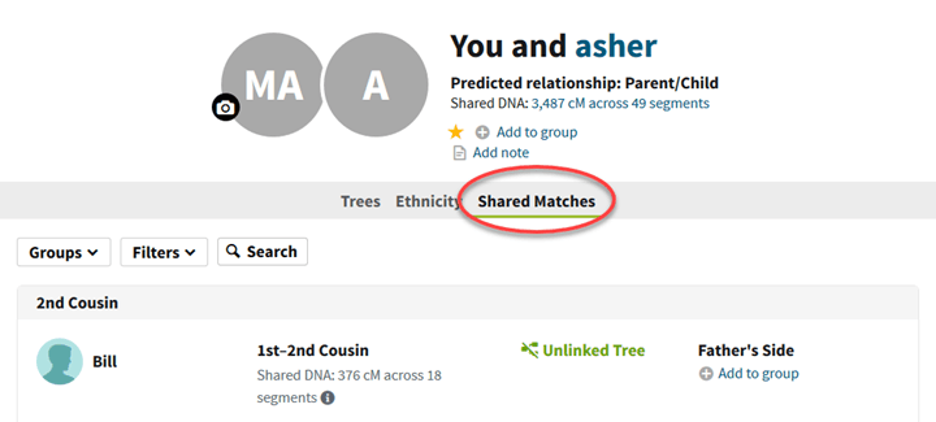
Seek Shared Matches
It is always advisable that we try and get other close family members to test their DNA as well. This can be particularly helpful in pinpointing your other DNA matches. You may be able to find out which side of your family a match comes from and perhaps an estimated relationship to a closer family member to you.
If, for example, a parent matches your 433 cM cousin match to a level that indicates a half-niece or nephew match this could be telling. The key to good genealogy is correlating your research and illuminating possibilities until you find the most probable.
Also, make use of other matches you receive on AncestryDNA and 23andMe. You may discover that several of your shared matches feature a known family name found in your own history. This can help pinpoint the lines to research.
Remember that even though we are searching backwards in time for our ancestors we can also research in the other direction. We can trace lines of our ancestors to the modern-day and we may find our way to our cousin match.
Why You Need Genealogy and the Chart
It has to be remembered that although extremely helpful, Centimorgan charts are still just estimates. They have been user-created and are therefore subject to a certain amount of potential error. The chart is great for directing your research into the possible connection but there is no substitute for documents and solid family tree building.
Conclusion
As a tool, DNA centimorgan charts are without question very valuable. A combination of DNA and document evidence can be all you need to confirm a family relationship. We must remember, however, that we do not share the same amount of DNA with all our cousins of the same level and in fact we may share none at all with some distant cousins.
Used correctly these charts can be key to breaking through those illusive brick walls. We must bear in mind, however, what awaits on the other side of those walls is not always welcome news.

Neil Edwards
Genealogist and family-tree research specialist
Link To or Reference This Page
We spent a lot of time downloading, cleaning, merging, and formatting the data that is shown on the site.
If you found the data or information on this page useful in your research, please use the tool below to properly cite or reference Name Census as the source. We appreciate your support!
-
<a href="https://namecensus.com/blog/dna-centimorgan-chart/">DNA Centimorgan Chart for Understanding DNA Relationships</a>
-
"DNA Centimorgan Chart for Understanding DNA Relationships". NameCensus.com. Accessed on April 28, 2024. https://namecensus.com/blog/dna-centimorgan-chart/.
-
"DNA Centimorgan Chart for Understanding DNA Relationships". NameCensus.com, https://namecensus.com/blog/dna-centimorgan-chart/. Accessed 28 April, 2024
-
DNA Centimorgan Chart for Understanding DNA Relationships. NameCensus.com. Retrieved from https://namecensus.com/blog/dna-centimorgan-chart/.